After the Mets made their picks in last week’s MLB Draft, many fans surely scrambled to the Baseball Cube, a website known for housing college statistics, to size up the newest members of the organization.
The problem with the brief consumption of data at that level is the lack of context. It isn’t uncommon to see a player in college post a batting average that hovers around .400, but it’s more impressive if that number comes out of the Southeastern Conference rather than the Missouri Valley Conference, for example. If we’re going to do it, we have to do it the right way.
While we don’t have the capability to calculate advanced metrics such as wRC+ or WAR (maybe we do, but I certainly don’t; plus, how much weight do those numbers hold at this level?), we can compare indicative figures like walk and strikeout rates and OPS (adjusted by a park factor) to the conference average. This method creates a neutral index to put players from across the country on a level field.
Below are the contextual numbers for the college hitters from the Mets’ 2019 draft class. First, a couple of notes: Stats from conference games only were used to maintain a consistent environment for comparing to the average. Players from a Division II school or junior college have their rows italicized. A figure of 100 equals exactly the conference average. If the column represents a “+” stat, each integer above 100 represents a percentage point greater than the conference average. For a “-” stat, the opposite applies; smaller is better. BB = “walk rate,” K = “strikeout rate,” OPS = “on-base plus slugging,” BPF = “ballpark factor (over 100 favors hitters, under favors pitchers),” Park Adj OPS = “OPS, adjusted for park factors,” BABIP = “batting average on balls in play.”
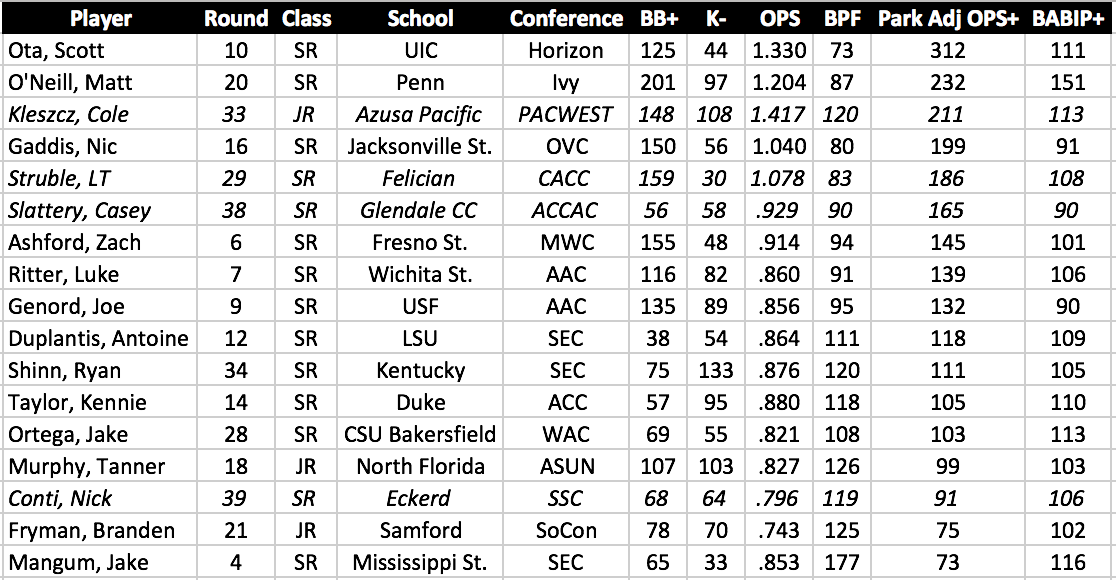
Observations:
- Scott Ota, man. In addition to recording fantastic walk and strikeout numbers, the former Flame absolutely mashed in a pitchers park. In fact, his 1.330 OPS came in the toughest stadium to produce in, according to the numbers above. Along with a respectable BABIP number, Ota could put up strong extra-base hit totals in pro ball.
- On the other end of the spectrum is Jake Mangum, who checks in with the lowest OPS+ of the group (which is, of course, being brought down by an insanely high park factor). While he avoided striking out, Mangum’s walk rate was also among the lowest, along with fellow SEC-ers Antoine Duplantis and Ryan Shinn. Numbers like those do raise some eyebrows, as walk rates don’t usually tend to improve from college to the pros, outside of the elite bats.
- It’s always difficult to predict how Division II players will adjust to the pro level, but Cole Kleszcz and his NCAA-leading (yes, all three levels) 27 home runs might be the exception. Despite playing in a hitters park, his OPS+ looks great, as does that 148 BB+ mark. Kleszcz struck out around 17 percent of the time but that was just a tick above the conference average. I’ll certainly be keeping a close eye on him as he makes the foray into the pro ranks.
- Good: Matt O’Neill‘s 201 BB+, Zach Ashford‘s 155 BB+ and 48 K-, Nic Gaddis‘ 199 OPS+ with a 91 BABIP+
- Bad: Kennie Taylor‘s 57 BB+, Shinn’s 133 K-, Branden Fryman‘s 78 BB+ and 75 OPS+
Keep in mind:
- These numbers don’t hold much weight without scouting reports. We’re working on getting those up on the site as soon as possible.
- I won’t be using short-season stats from these players’ first pro seasons to determine whether the above numbers were accurate or not.
- I would have liked to use multi-year park factors but I simply didn’t have the manpower to accumulate that information.
- The sample sizes on these figures aren’t too large, but I felt there was enough substance to analyze.
- I’ll hopefully be able to get up a similar look at the pitchers from this year’s draft class soon.